

Smarter. Easier. Accurate. Optimized
Successful planning of large and spread out civil construction projects is an optimization challenge that the TILOS software is purpose-built for; industry specific analysis helps establish and visualize a proper plan of execution with emphasis on movement and flow around the jobsite.
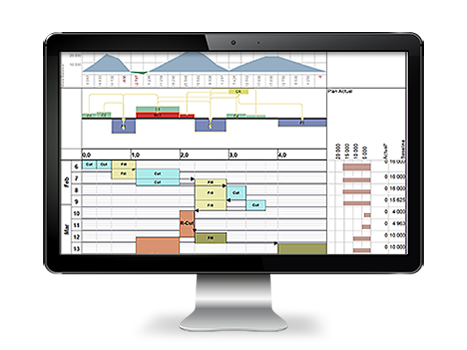
Detailed information about current activities by location enables precise production management opportunities and provides the transparency necessary to ensure on-time delivery of projects. Outputs from TILOS are highly visual and can easily be deciphered by owners and construction workers alike. TILOS provides the confidence to know the exact status of a project, without any guesswork required.

Top 5 Reasons For TILOS
- Linear Scheduling Planning linear construction projects by using time location diagrams and the comprehensive linear scheduling features is highly effective. Deliver optimized and reliable schedules. Communicate your projects effectively.
- Professional Presentations Present high-quality plans that showcase your talent and give confidence in your ability to deliver. Visualize the whole project on a single summary. Assist the whole team and the key stakeholders to easily understand the plan.
- Integrated Project Planning You do the planning using industry-specific planning features. TILOS calculates the deadlines and the total time required in one integrated system.
- Open Data Exchange Exchange data with other project management systems such as Primavera P6, Microsoft Project and Asta Powerproject. Import site data such as mass haul, elevation or site map. Insert quantities, equipment and costs from spreadsheet.
- Cost Effective TILOS quickly pays for itself when compared to other planning methods. Reduced planning time with improved schedule clarity results in more smooth construction sequences and helps to avoid clashes and machine downtime.
- Highway Construction TILOS provides a comprehensive planning tool for road projects of all sizes and complexity.
- Pipeline Construction Pipeline construction presents construction challenges such as maintaining crew separation, equipment move-arounds, permitting, land acquisition and crossings.
- Railway Construction TILOS comes with a set of special railway building functions to support the daily work of the planners.
- Engineering In bridge projects the pile and foundation work is normally created as rectangles showing at which pile the work gets executed. This work is repeated in time for each pile. TILOS supports bulk creation of tasks – each on the defined position.
- Tunnel Construction TILOS supports a number of special functions for tunnel builders to make planning easier while delivering even more data.
- Water Engineering Harbor facilities, waterways, canals, wave-breakers, dikes, barrages, widespread sheet pile walls – many buildings along and across waters and the sea are linear projects.
Features
Scaled Location Charts
- Use powerful drawing tools to place symbols and objects based on distance coordinates
- Use a symbol library to easily prepare scheme drawing diagrams
- Import existing route-diagrams directly into the chart and scale them to size automatically
- One chart has everything you need
- Split the chart into multiple sections so you can display more information
- Clearly show the different stages of construction
- Include detailed drawings with site plans
- Show resource usage (plant, people and materials)
Customizable Views
- Define project, scale, site plan and chart areas, and use them to create customizable project views showing common data in different ways
- Set axis orientation and direction individually for each cell
- Integrate Gantt diagrams, time and location diagrams, cost and resource diagrams, and spatial information to one comprehensive chart
Progress Tracking
- Update projects regularly and monitor actual progress against the original plan
- Progress tasks by location as well as by time and completion percentage attained
- Baseline and compare the original plan to current project progress to detect variances immediately and compensate for them in real-time
- Instantly update the current project status and calculate new deadlines with reference to the reporting date
- Calculate earned value measures for tasks and sub-projects
- Display distance progress as a distance Gantt chart
Resource and Cost Planning
- Reduce risk by integrating cost, quantity and performance planning
- Calculate task duration from the working speed (performance) and the distance or from work quantity and performance
- Calculate resource utilization using quantities or time with flexible calculation models
- Create quantity and cost charts to show time-specific and absolute resource requirements over the duration of a project
- Compare costs and income to show project profit
- Compare values with a project baseline or use other project profiles
- Calculate costs based on resource usage
Mass Haul Data and Diagrams
- Create different types of material such as cut, fill and disposal
- Enter or import different cut/fill locations and quantities
- Create tasks based on quantity and productivity for each cut/fill movement to quickly build a schedule
- Display consumption graphs based on location or time